Why Your Website Is Slow Despite Good Hosting and How to Fix It
By Noura Mint Ely · November 4, 2026

Table of contents
- 1. Your Hosting Is Only One Part of the System
- 2. Measure the Delay Before Changing Anything
- 3. Understand What Your Speed Metrics Reveal
- 4. Fix Slow Server Responses First
- 5. Enable Proper Page Caching
- 6. Optimise Images That Visitors Actually See
- 7. Remove JavaScript That Blocks the Browser
- 8. Reduce Plugins and Theme Overhead
- 9. Investigate Database Bottlenecks
- 10. Check Your CDN and Visitor Distance
- 11. Identify Slow Third Party Services
- 12. Examine Fonts, CSS, and Page Layout
- 13. Test Mobile Performance Separately
- 14. Follow a Practical Troubleshooting Order
- 15. Know When Hosting Really Is the Problem
- 16. Avoid Performance Fixes That Create New Problems
- A Faster Website Starts With Accurate Diagnosis
- Frequently Asked Questions
1. Your Hosting Is Only One Part of the System
Why is my website slow even with good hosting?
Because hosting capacity is only one part of website performance.
A powerful server cannot compensate for oversized images, inefficient database queries, excessive JavaScript, poorly configured caching, slow external services, or a theme that makes the browser work too hard.
The server may be delivering pages quickly while visitors still wait for the content to appear or buttons to respond.
Before upgrading your hosting plan, identify where the delay occurs.
The distinction between server response, resource delivery, and browser rendering determines which fix will actually improve speed.
There is a common assumption behind many website performance problems: if a website runs on a powerful VPS, dedicated server, or premium managed hosting plan, it should automatically load quickly.
That assumption overlooks how a modern website is assembled.
A visitor does not simply request a file from a server and receive a finished page.
The browser requests the HTML document, discovers additional resources, downloads stylesheets and scripts, retrieves images and fonts, executes JavaScript, builds the page layout, and waits for any essential external services.
A content management system may also need to communicate with a database before it can generate the requested page.
Every part of that process can introduce delays.
Consider a website running on a well configured VPS with sufficient memory, multiple CPU cores, and fast SSD storage.
The server might generate the HTML in a fraction of a second.
However, the page could still contain a large hero image, several advertising scripts, multiple font files, an oversized JavaScript bundle, and a collection of plugins that initiate additional requests.
The visitor experiences the entire sequence, not just the server's response time.
This explains why two websites hosted on the same infrastructure can perform very differently.
One might use a lightweight theme, properly sized images, page caching, and a small number of scripts.
The other might load dozens of unnecessary resources before displaying its main content.
The first step is to stop treating website speed as a hosting specification.
It is a complete delivery process involving infrastructure, application code, databases, content, networks, and browsers.
A better investigation begins by identifying the type of delay:
Does the browser wait a long time before receiving the first response?
Does the HTML arrive quickly, but images and stylesheets take too long?
Does the page appear, but remain unresponsive?
Does the homepage load quickly while articles or category pages are slow?
Is the website fast for visitors near the server but slow in other countries?
Does performance deteriorate during traffic peaks?
Each answer points toward a different technical cause.
Finding that cause before making changes saves money and prevents unnecessary configuration work.
2. Measure the Delay Before Changing Anything
The most expensive performance mistake is changing several settings without first identifying what is slow.
You might install another caching plugin, upgrade the server, replace the theme, or enable aggressive script optimisation, only to discover that the real problem was a single external widget.
Start with measurements.
Three tools provide a useful foundation for diagnosing most websites: Google PageSpeed Insights, Chrome DevTools, and Google Search Console.
Each offers a different view of performance.
Google PageSpeed Insights
<text color="secondary" inline>Tool: PageSpeed Insights</text>
PageSpeed Insights evaluates a URL using Lighthouse and, when available, real user performance data from the Chrome User Experience Report.
It provides separate mobile and desktop assessments.
This distinction matters because a website that performs well on a desktop connection may struggle on a mobile device with a slower connection or less processing power.
Pay particular attention to the performance opportunities and diagnostics.
They can identify large image downloads, render blocking resources, excessive JavaScript, unused CSS, and other issues affecting the tested page.
Do not treat the overall score as the only meaningful result.
A score of 90 does not automatically mean every visitor experiences a fast website, just as a score of 65 does not identify one specific server problem.
The individual measurements and diagnostic evidence are more useful than the headline number.
Chrome DevTools
<text color="secondary" inline>Tool: Google Chrome Developer Tools</text>
Open your website in Chrome, right click the page, select Inspect, and open the Network tab.
Reload the page with the Network panel open.
You will see the resources requested by the browser, including HTML, CSS, JavaScript, images, fonts, and third party services.
Examine the Duration column and identify unusually slow requests.
Also inspect the transferred file sizes and the Initiator information, which can help establish what caused a particular resource to load.
The Waterfall view is especially useful because it shows when requests begin, how long they take, and which resources depend on others.
For example, if the HTML document arrives quickly but a large JavaScript file takes several seconds to download and execute, the problem may be frontend optimisation rather than hosting.
If the HTML document itself takes a long time to respond, investigate the application, database, server configuration, and caching behaviour.
Google Search Console
<text color="secondary" inline>Tool: Google Search Console</text>
The Core Web Vitals report provides field data based on actual Chrome users.
It groups similar URLs and reports their performance according to real world loading, responsiveness, and visual stability.
This information is valuable because laboratory tests and real visitor experiences are not identical.
A laboratory test measures a controlled page load under particular conditions.
Field data reflects the conditions experienced by real visitors, including different devices, connections, and browsing environments.
Use both sources.
PageSpeed Insights and Lighthouse help investigate individual pages, while Search Console helps identify patterns affecting groups of URLs.
A useful initial procedure is:
Test the homepage on mobile and desktop.
Test one article page.
Test one category or archive page.
Test a page containing several images or embedded elements.
Compare the results and identify issues that appear repeatedly.
Record the main measurements before making changes.
This gives you a baseline.
Without one, you cannot reliably determine whether a change has improved the website or simply altered a testing score.
3. Understand What Your Speed Metrics Reveal
Website speed is not represented by one measurement.
Different metrics describe different stages of the visitor experience.
Understanding them helps you avoid fixing the wrong problem.
Time to First Byte (TTFB)
TTFB measures the time between the browser starting a request and receiving the first byte of the response.
It includes several stages, such as connection establishment, request processing, and server response.
A high TTFB can indicate slow application execution, database delays, insufficient server resources, network latency, or ineffective caching.
It is particularly useful when investigating whether the website takes too long to begin responding.
A fast TTFB is desirable, but it does not guarantee that the complete page will load quickly.
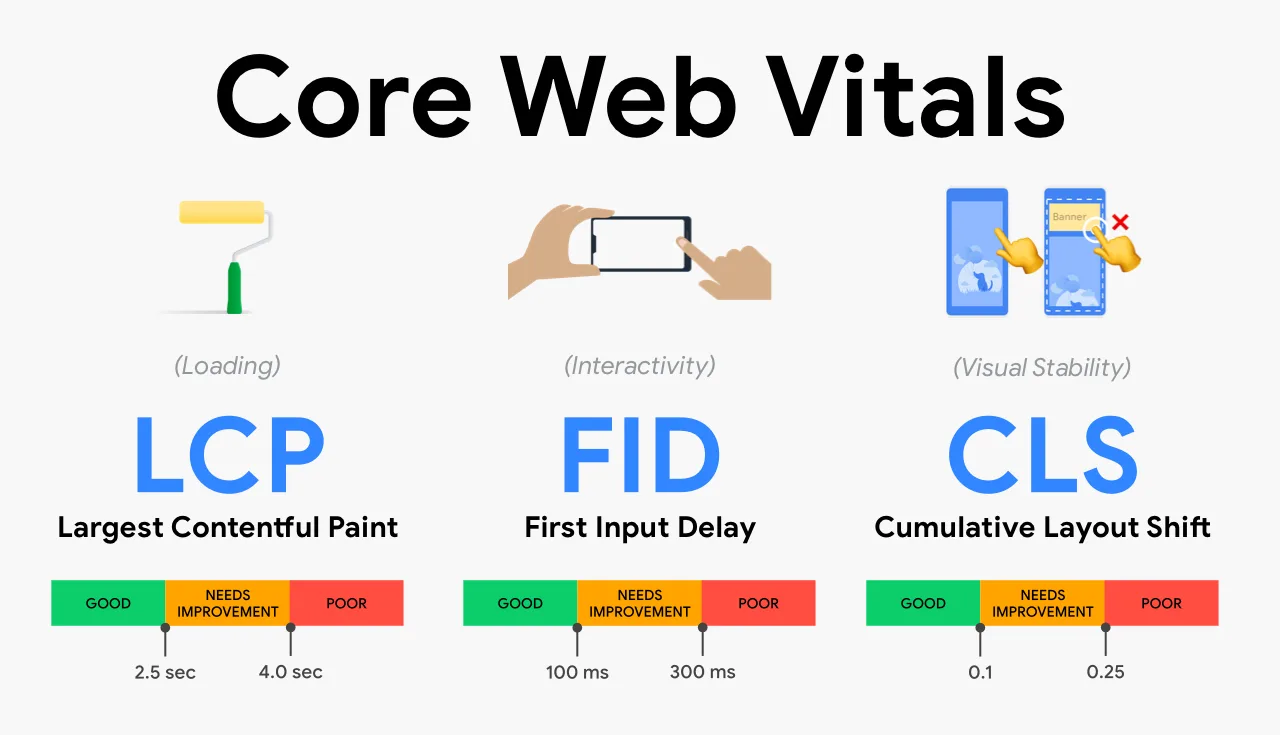
Largest Contentful Paint (LCP)
LCP measures when the largest visible content element has rendered.
This is commonly a prominent image, a large heading, or another substantial content element.
If your article page displays a large featured image at the top, that image may determine the LCP measurement.
A page can have a good server response time but poor LCP because the browser waits for the image, stylesheet, or other resource needed to display the main content.
Google recommends an LCP of 2.5 seconds or less for a good user experience.
Interaction to Next Paint (INP)
INP measures how responsive a page is to user interactions during a visit.
A page may appear fully loaded but still feel slow when someone opens a navigation menu, clicks a button, filters products, or submits a form.
Heavy JavaScript, long main thread tasks, expensive event handlers, and poorly implemented third party scripts can contribute to poor responsiveness.
Google recommends an INP of 200 milliseconds or less for a good user experience.
Cumulative Layout Shift (CLS)
CLS measures unexpected movement of page elements during the visitor's experience.
Imagine clicking a button just as an advertisement loads above it.
The page shifts, and the visitor accidentally clicks something else.
Missing image dimensions, dynamically inserted advertisements, late loading fonts, and elements that change size can contribute to this problem.
Google recommends a CLS score of 0.1 or less.
These three Core Web Vitals measure loading performance, responsiveness, and visual stability.
They do not describe every aspect of website performance, but together they provide a useful picture of the user experience.

Hostinger VPS
Hostinger VPS delivers KVM virtualization, NVMe storage and full root access at prices that undercut most competing cloud providers.
- Strong price to specification ratio overall
- NVMe storage included on every tier
- Renewal rates climb steeply after promo
- Self managed means security is your job
For a practical diagnosis, interpret the metrics together:
High TTFB suggests investigating the server, application, database, or caching.
Poor LCP suggests examining the main visible content and the resources needed to display it.
Poor INP suggests investigating JavaScript and browser processing.
Poor CLS suggests examining layout dimensions and dynamically inserted content.
The distinction is important.
Reducing image sizes may improve LCP, but it will not necessarily solve a slow database query.
Increasing CPU resources may help application processing, but it will not automatically make a heavy navigation menu responsive.
Use the measurement that corresponds to the problem.
4. Fix Slow Server Responses First
If the browser waits too long for the initial HTML document, investigate the server response before spending time optimising images or redesigning the page.
A website running WordPress, for example, may need to execute PHP, load configuration, retrieve information from MySQL or MariaDB, process plugins, apply theme logic, and generate the final HTML.
A powerful server can still deliver a slow response if the application performs unnecessary work on every request.
Start by checking whether the server has enough available resources.
CPU utilisation can reveal whether application processing is consuming too much computing capacity.
Memory usage can expose excessive PHP workers, large database operations, or insufficient available RAM.
Storage performance matters when applications repeatedly access files or databases.
However, do not assume that high resource utilisation is always the cause.
A server can have low CPU usage while waiting for a slow external API or database query.
Examine the following areas:
PHP configuration
For a PHP based website, check the PHP version and configuration.
Unsupported or outdated versions may lack performance improvements and can introduce security concerns.
Use a version supported by your CMS, theme, and plugins.
Test compatibility before changing production environments.
Also examine PHP worker availability.
If every worker is occupied by a long running request, additional visitors may wait even when the server still has available CPU capacity.
Database execution
A slow database query can delay the entire page generation process.
Investigate query duration, database load, missing indexes, unnecessary joins, and repeated queries.
A website with many plugins may execute a large number of queries during a single page request.
Improving one expensive query can produce a larger benefit than upgrading the server.
Server software
Review the web server configuration, PHP execution environment, database service, and available caching mechanisms.
Apache and Nginx can both deliver fast websites when properly configured.
Neither is automatically the solution to every performance issue.
For Nginx deployments, examine upstream response times, PHP FastCGI processing, connection handling, and static file delivery.
Server capacity
Compare actual resource consumption with the available capacity during normal and peak traffic.
Look for CPU saturation, memory pressure, storage latency, and unexpected process accumulation.
If the application consistently exhausts its available resources, additional capacity may be justified.
If the resources are largely idle, an upgrade is unlikely to solve the underlying issue.
A server performance investigation should answer one central question: is the application genuinely waiting for infrastructure, or is the infrastructure waiting for inefficient application behaviour?
That distinction prevents unnecessary spending.
5. Enable Proper Page Caching
Caching is one of the most effective ways to reduce repeated processing on a website.
Without page caching, a content management system may generate the same article page every time a visitor requests it.
That can involve PHP execution, database queries, plugin processing, and theme rendering.
A page cache stores a previously generated version of the page and serves it again when the request qualifies.
Instead of repeating the complete application process, the server can deliver the stored HTML response.
For a publication with hundreds of articles, this can significantly reduce repeated work.
There are several types of caching, and they solve different problems.
Full page caching
Stores generated HTML pages so repeated requests do not require the application to build the page from scratch.
It is particularly useful for content that changes infrequently, such as articles, category pages, and informational pages.
Browser caching
Allows a visitor's browser to reuse previously downloaded resources, such as logos, stylesheets, fonts, and images, according to the configured caching rules.
This can reduce repeated downloads when someone visits multiple pages on the same website.
Object caching
Stores frequently requested application data so the system does not need to retrieve or calculate it repeatedly.
For WordPress, a persistent object cache using Redis or Memcached can reduce repeated database operations when properly configured.
Opcode caching
PHP applications can benefit from opcode caching.
OPcache stores compiled PHP bytecode in shared memory, reducing the need to compile the same PHP files repeatedly.
This does not replace page caching, but it can improve PHP application performance.
CDN caching
A content delivery network stores eligible resources at distributed edge locations, allowing visitors to retrieve content from a location closer to them.
Cloudflare, for example, can cache static resources such as images, CSS, and JavaScript.
HTML caching requires suitable rules and configuration because dynamic pages and personalised content need different treatment.
The important detail is that installing a caching plugin does not mean caching is working correctly.
Verify the actual response behaviour.
Inspect HTTP response headers, test repeat visits, and check whether cache hits occur.
Also understand what should not be cached indiscriminately.
Shopping carts, account pages, personalised dashboards, checkout sessions, and other user specific content may require bypass rules.
Incorrect caching can display outdated information or expose one visitor's personalised content to another.
A good caching configuration distinguishes between public content and content that must remain private or dynamic.
6. Optimise Images That Visitors Actually See
Images are among the most common reasons websites remain slow after moving to better hosting.
A server can deliver an image quickly, but a very large file still takes time to transfer and decode.
The visitor's browser must also allocate resources to display it.
Imagine uploading a photograph that measures 5000 pixels wide when the website displays it inside a content area only 900 pixels wide.
The browser may receive far more image data than the layout requires.
The solution begins before the image reaches the website.
Resize images according to their intended display dimensions.
A featured image, article thumbnail, logo, and small profile photograph should not all use the same source dimensions.
Choose an appropriate format.
WebP offers modern image compression and is supported by current major browsers.
AVIF can provide further compression benefits in suitable workflows, although encoding and compatibility requirements should be checked.
JPEG remains useful for photographs, particularly where an established publishing workflow depends on it.
PNG is appropriate when transparency or lossless image quality is required, but it can produce unnecessarily large files for ordinary photographs.
Do not convert every image blindly.
Compare visual quality and file size.
Responsive images are equally important.
A mobile visitor should not have to download a very large desktop image when a smaller version can provide sufficient visual quality.
Use the browser's responsive image selection capabilities or a suitable image optimisation system to deliver different sizes.
Also distinguish between images above and below the fold.
The main image visible when the page opens may be the LCP element.
It should be discoverable early and receive appropriate loading priority.
Images further down the page can usually use lazy loading so the browser downloads them as visitors approach the relevant content.
Do not lazy load the main LCP image.
Delaying the most important visible image can make the page feel slower even when the total amount of downloaded data decreases.
Check whether your CMS automatically generates image sizes and whether the theme uses the correct versions.
Some themes generate thumbnails but still display the original high resolution image in situations where a smaller version would be sufficient.
Finally, inspect images served from external domains.
A website may appear to have optimised its own media library while still loading large promotional images, embedded content, and external thumbnails from third party services.
Image optimisation should reduce unnecessary transfer without making the website look visibly worse.
A good editorial website needs sharp featured images, readable thumbnails, and consistent presentation, but it does not need to send oversized originals to every visitor.
7. Remove JavaScript That Blocks the Browser
JavaScript can make a website interactive, but excessive or poorly organised scripts can delay rendering and prevent visitors from interacting with the page.
This is a common problem on websites that accumulate features over time.
A site might start with a simple theme, then acquire a page builder, analytics scripts, advertising systems, social sharing tools, animation libraries, consent management software, popups, recommendation widgets, and several tracking services.
Each addition may appear harmless.
Together, they can create a large amount of JavaScript for the browser to download, parse, compile, and execute.
The browser's main thread handles important work, including JavaScript execution, style calculations, layout, and rendering.
When long tasks occupy the main thread, interactions may become delayed.
This can affect INP even when the page appears visually complete.
Use Chrome DevTools to inspect JavaScript resources and identify scripts that consume significant processing time.
Lighthouse can also highlight excessive JavaScript execution and unused code.
Prioritise the scripts that are necessary for the initial experience.
A navigation menu may be important.
A social sharing widget that appears near the bottom of an article is unlikely to deserve the same loading priority.
Consider the following improvements:
Remove scripts that provide no meaningful value.
Load nonessential scripts only when needed.
Defer scripts that do not need to execute immediately.
Reduce unnecessary dependencies.
Avoid loading the same library multiple times.
Split large application bundles where appropriate.
Replace heavy widgets with simpler alternatives when the feature is not essential.
The defer and async attributes can change how external scripts are downloaded and executed, but they are not interchangeable.
A deferred script generally executes after HTML parsing, maintaining document order among deferred scripts.
An asynchronous script executes when it becomes available, without guaranteeing the same order.
Incorrectly changing script loading behaviour can break menus, forms, analytics, or other features that depend on execution order.
Test every change on a staging environment before applying it to a production website.
Also remember that minification and compression are not the same as removing unnecessary JavaScript.
A smaller script is useful, but a script that never needed to load is better.
For a content website, examine whether interactive features are genuinely required on every page.
A complex product comparison tool may belong on a specific review page rather than being loaded across every article.
The objective is to reduce unnecessary browser work while preserving the features visitors actually use.
8. Reduce Plugins and Theme Overhead
WordPress makes it easy to add functionality without developing everything from scratch.
That flexibility is useful, but it can create performance problems when a website accumulates plugins without reviewing their impact.
A plugin may execute PHP during page generation, query the database, load stylesheets, enqueue JavaScript, communicate with external services, or schedule background tasks.
Some plugins are lightweight.
Others can add substantial processing overhead.
The number of plugins alone does not determine website speed.
A website with 30 carefully selected plugins can outperform one with 10 poorly developed extensions.
What matters is what each plugin does and how it behaves.
Start by reviewing the installed plugins and grouping them by purpose.
Ask whether each one provides a feature visitors or administrators genuinely need.
Look for duplicated functionality.
Two plugins may both provide analytics, image optimisation, caching, security scanning, or social sharing.
Running overlapping tools can create conflicts and unnecessary resource consumption.
Next, examine whether a plugin loads assets on every page.
A form builder may only be needed on a contact page.
A product comparison script may only be necessary on review pages.
Loading these resources globally increases the amount of work performed on unrelated pages.
Some plugins provide settings to control where assets load.
Others require configuration through the theme or a developer.
Theme selection matters as well.
A visually impressive theme may include animation systems, complex layout builders, multiple font families, icon libraries, sliders, and several additional scripts.
These features can increase the amount of HTML, CSS, and JavaScript the browser needs to process.
A lightweight theme with a clear design system may offer better performance and easier maintenance.
However, do not replace your theme solely because a performance tool identifies unused CSS.
First establish whether the issue can be corrected through configuration or asset optimisation.
When investigating plugins, use a staging environment.
Deactivate one suspected plugin at a time, repeat the same performance test, and compare the results.
If performance improves significantly, investigate whether the plugin can be replaced, configured differently, or restricted to specific pages.
Never deactivate essential security, backup, payment, or business functionality on a live website merely to experiment.
For a site that publishes regularly, plugin maintenance should be part of the editorial and technical workflow.
Every new feature introduces a potential maintenance and performance cost.
9. Investigate Database Bottlenecks
A website can have fast storage, generous memory, and plenty of CPU capacity while still responding slowly because its database is doing unnecessary work.
This is particularly relevant to WordPress, WooCommerce, membership platforms, and other applications that generate pages dynamically.
A database request retrieves information needed by the application.
For a WordPress article, this may include the post content, title, metadata, category information, author details, theme settings, and plugin data.
If these queries are inefficient or repeated unnecessarily, the application can spend a surprising amount of time waiting for the database.
One common issue is the accumulation of unnecessary database records.
WordPress installations can contain old post revisions, expired transient records, abandoned plugin data, and other information that is no longer needed by the active website.
However, database size alone does not establish that the database is slow.
A large, properly indexed database can perform well, while a much smaller database can suffer from inefficient queries.
Investigate actual query behaviour before cleaning records.
Hostinger VPS
Hostinger VPS delivers KVM virtualization, NVMe storage and full root access at prices that undercut most competing cloud providers.
- Strong price to specification ratio overall
- NVMe storage included on every tier
- Renewal rates climb steeply after promo
- Self managed means security is your job
Look for slow queries
MySQL and MariaDB provide tools and logging options that can help identify queries taking unusually long to execute.
A database administrator can examine these queries and determine whether they need better indexing, a different query structure, or changes to the application.
Check database indexes
Indexes help the database locate records without scanning an entire table unnecessarily.
Missing or unsuitable indexes can become expensive when tables grow.
Do not add indexes randomly.
Every additional index has storage and maintenance costs, particularly during inserts and updates.
The correct index depends on the queries being executed.
Review autoloaded WordPress options
WordPress loads certain options automatically during normal application execution.
If plugins accumulate large amounts of autoloaded information, the application may retrieve more data than necessary on many requests.
Review unusually large autoloaded options and identify which plugin or component created them.
Removing records without understanding their purpose can break functionality.
Consider persistent object caching
A persistent object cache can store frequently requested data in a service such as Redis or Memcached.
This reduces repeated database work for data that can be safely reused.
The WordPress object cache normally operates within a request unless a persistent backend is configured.
A properly installed persistent cache can extend reuse across requests.
Review background activity
Scheduled tasks, imports, analytics processing, backups, and plugin maintenance operations can consume database resources.
If a website slows down at predictable times, compare those periods with scheduled jobs and database activity.
For example, a plugin that imports thousands of records every hour may affect page generation during the import.
Database optimisation should be evidence driven.
If queries are already fast and database resources are healthy, focus elsewhere.
10. Check Your CDN and Visitor Distance
The location of your server matters more than many website owners realise.
A server in Europe may respond quickly to a visitor in the same region, but someone accessing the same website from another continent may experience additional network latency.
The request must travel between the visitor and the origin server.
The response must then travel back, and this happens alongside the retrieval of images, scripts, stylesheets, and other resources.
A content delivery network, or CDN, can reduce some of this distance by distributing eligible resources across geographically distributed servers.
Cloudflare is a widely used example.
Its network can deliver cached static content from locations closer to visitors, reducing the need to retrieve every image, stylesheet, or JavaScript file from the original hosting server.
However, enabling a CDN does not automatically make every page faster.
The CDN must be configured correctly, and the resources must be eligible for caching.
Static resources are generally easier to cache.
Dynamic HTML, personalised pages, and content involving user sessions require more careful rules.
For example, a public article can often be cached safely when its content is the same for everyone.
A logged in account dashboard should not be delivered from a shared cache without appropriate controls.
Check the response headers to understand whether resources are being cached.
Look for the relevant cache status information provided by your CDN and verify that repeat requests behave as expected.
Also review the origin server's cache control headers.
A CDN may respect instructions that prevent caching, such as private or no store directives, depending on its configuration and applicable rules.
Another important consideration is DNS and connection setup.
A slow connection establishment process can delay the first request even when the origin server performs well.
Use modern HTTP protocols supported by your infrastructure.
HTTP/2 and HTTP/3 can improve connection efficiency, although enabling them does not fix an inefficient application or oversized page.
If your visitors are geographically distributed, test from multiple locations.
A speed test performed next to your server does not represent the experience of someone accessing the website from another region.
For international publications, the combination of origin hosting, CDN coverage, image optimisation, and sensible caching policies is often more effective than moving the server repeatedly in search of a better location.
11. Identify Slow Third Party Services
A website depends on more than its own hosting environment.
It may also load resources from advertising networks, analytics platforms, video services, consent management systems, social media platforms, external fonts, and embedded applications.
These services operate independently of your server.
Suppose your homepage loads its HTML in 300 milliseconds, and the main image arrives shortly afterward.
However, the page includes several external advertising scripts, an analytics library, a social widget, and an embedded video player.
If one of those services responds slowly or executes a large amount of JavaScript, the visitor may still experience a delayed page.
The hosting provider cannot directly control the performance of those external systems.
Open Chrome DevTools and inspect the Network tab.
Sort resources by domain and duration.
This helps identify which external services contribute the most requests and processing time.
Pay particular attention to:
Advertising scripts.
Tracking and analytics tags.
Embedded videos.
Social media widgets.
External font providers.
Chat applications.
Consent management platforms.
Recommendation and personalisation services.
A useful test is to compare the page with and without a particular third party integration in a staging environment.
Do not remove analytics or advertising from a production website simply because they appear in the request list.
First establish their business importance and whether the integration can be loaded more efficiently.
For example, an embedded video may not need to load its full player immediately.
A preview image with a click to load interaction can reduce the initial work required by the browser.
Likewise, a social sharing widget may be replaced by simple links or lightweight buttons if its full script provides little additional value.
Advertising requires special attention because multiple advertising scripts and auctions can affect both loading performance and responsiveness.
The solution may involve reviewing the number of ad placements, loading strategy, and vendor configuration.
External services should be treated as part of your performance budget.
Every integration needs a reason to exist and should justify the additional resources it requires.
12. Examine Fonts, CSS, and Page Layout
Images and JavaScript receive much of the attention during optimisation, but CSS and fonts can also delay the visible presentation of a page.
CSS tells the browser how content should look and where elements should appear.
The browser needs to process the relevant styles before displaying a properly styled page.
Large stylesheets, unnecessary frameworks, and excessive theme styling can delay rendering.
A common problem is loading an entire design framework when a website uses only a small portion of its features.
Another is accumulating CSS from multiple plugins and page builders.
Even after a feature is removed from the page, its styles may remain in the resources loaded by the theme.
Lighthouse can identify unused CSS, while Chrome DevTools can help determine which styles are actually used on a particular page.
Reducing unnecessary styles can lower download and processing costs.
However, removing CSS requires care.
A stylesheet that appears unused on the homepage may be essential on an article, category, or mobile navigation page.
Fonts deserve similar attention.
A website that loads several families, weights, and styles can create unnecessary requests.
Each additional font resource can affect loading and rendering, particularly on mobile connections.
Use only the font families and weights required by the design.
Consider hosting fonts locally when appropriate, but remember that local hosting still requires correct file optimisation, caching, and font loading behaviour.
Use font-display settings thoughtfully to control how text appears while a font loads.
Also provide dimensions or aspect ratios for images and media containers.
This allows the browser to reserve the correct amount of space before resources finish downloading.
Without reserved dimensions, the layout may shift when images or advertisements appear.
A visually stable website feels more professional and makes it easier for visitors to interact with links, menus, and buttons.
The objective is a clean rendering path.
The browser should receive the essential styles and fonts efficiently, establish the layout, and display the main content without waiting for unnecessary design resources.
13. Test Mobile Performance Separately

A website that performs well on a desktop computer can still be slow on a smartphone.
Desktop devices often have more processing capacity, larger screens, and access to faster connections.
Mobile visitors may use older hardware, limited memory, unstable wireless connections, or slower mobile networks.
This changes how the website behaves.
A large image may be less noticeable on a desktop connection but take considerably longer to download on a mobile device.
A complex navigation menu may feel immediate on a powerful computer but respond slowly on an entry level smartphone.
Mobile testing should therefore be part of every performance investigation.
Start with the mobile version of PageSpeed Insights.
Examine LCP, INP, CLS, and the individual recommendations.
Then use Chrome DevTools device emulation to inspect responsive layouts and resource behaviour.
Device emulation is useful, although it does not perfectly reproduce the performance of every physical phone.
Pay attention to the first screen visitors see.
Does the main heading appear quickly?
Is the featured image unnecessarily large?
Does the navigation menu require several scripts?
Are advertisements pushing the content down?
Does a consent banner cover the entire screen?
Review the page at realistic mobile widths.
A desktop layout that simply shrinks to fit a smaller screen can still produce poor usability and unnecessary rendering work.
Also examine the number of elements loaded before the visitor reaches the article.
A publication page may contain a logo, navigation, advertisements, featured image, social widgets, recommendation blocks, and several scripts before the main text becomes visible.
Prioritise the content visitors came to read.
A good mobile experience does not require removing every visual feature.
It requires ensuring that important content appears promptly and that secondary features do not prevent visitors from using the page.
If mobile performance remains poor while desktop performance is strong, investigate responsive image selection, mobile specific scripts, layout complexity, font loading, and device processing costs before changing hosting.
14. Follow a Practical Troubleshooting Order
Website optimisation becomes more effective when changes are made in a controlled sequence.
Changing the server, theme, plugins, caching, and CDN settings simultaneously makes it difficult to establish which action produced the improvement.
Use a repeatable diagnostic process.
Step 1: Establish a baseline
Choose representative URLs and test each one on mobile and desktop.
Record the main Core Web Vitals, TTFB, page size, and important network requests.
Use the same test conditions when comparing results.
Step 2: Separate server delay from browser delay
Inspect the initial HTML request in Chrome DevTools.
If the first response is slow, investigate server processing, application execution, database activity, and caching.
If the response is quick, but the page takes a long time to become usable, focus on images, scripts, stylesheets, fonts, and external services.
Step 3: Verify page caching
Check whether eligible pages are being served from cache.
Inspect response headers and compare first visits with repeat visits.
Make sure personalised and transactional content is excluded from inappropriate caching.
Step 4: Optimise the main image
Identify the LCP element and examine its dimensions, format, file size, and loading priority.
Make sure the browser can discover the image early.
Avoid lazy loading the main image when it is visible immediately.
Step 5: Review scripts and plugins
Identify resources that contribute significant transfer size or execution time.
Test suspected plugins individually on staging.
Remove unnecessary integrations and restrict assets to the pages that need them.
Step 6: Examine database and PHP performance
If the initial response remains slow, investigate slow queries, PHP execution, persistent object caching, resource usage, and background tasks.
Do not upgrade the database server without evidence that it is the limiting component.
Step 7: Check the CDN and external services
Confirm that static assets are being cached correctly and identify third party services that delay loading or interaction.
Test the website from more than one geographic location.
Step 8: Repeat the measurements
Run the same tests again.
Compare the results with the original baseline and verify that the website still works correctly.
Check the homepage, articles, category pages, forms, and any other important templates.
A performance improvement is only useful when it preserves functionality and produces a better experience for real visitors.
15. Know When Hosting Really Is the Problem
Hosting should not be blamed automatically, but it should not be excluded from the investigation either.
There are situations where infrastructure is genuinely responsible for slow performance.
A shared hosting account may experience resource contention.
A VPS may have insufficient CPU or memory for its workload.
A database server may be overloaded.
Storage may be slow.
Network connectivity may be unreliable.
PHP workers may be exhausted during traffic peaks.
The challenge is proving that the infrastructure is responsible.
Look for recurring patterns.
If TTFB increases significantly during busy periods, examine server load and application concurrency.
If several unrelated websites on the same server become slow simultaneously, investigate the host system and shared resources.
If static files are delivered quickly but dynamic pages respond slowly, examine application and database processing.
If the server responds quickly from a nearby monitoring location but slowly from distant regions, investigate network routing and CDN coverage.
If resource usage consistently reaches capacity while requests queue, additional server resources may be necessary.
Hosting support can also provide useful information.
Hostinger VPS
Hostinger VPS delivers KVM virtualization, NVMe storage and full root access at prices that undercut most competing cloud providers.
- Strong price to specification ratio overall
- NVMe storage included on every tier
- Renewal rates climb steeply after promo
- Self managed means security is your job
Ask for resource utilisation, process limits, storage performance, database diagnostics, and evidence of infrastructure incidents.
Be specific.
Saying that a website feels slow provides little information.
Reporting that the initial HTML response takes several seconds during peak traffic and that PHP workers are reaching their limit gives the provider something concrete to investigate.
An upgrade makes sense when the current environment cannot handle the legitimate workload efficiently.
For example, a growing publication may have increased its traffic, installed additional applications, and expanded its database.
The original VPS configuration may no longer provide sufficient capacity.
In that case, additional CPU, memory, database resources, or a different hosting architecture may help.
But if the application is spending most of its time loading unnecessary plugins and repeatedly querying the same information, upgrading may simply make inefficient software run at a higher cost.
The correct decision follows the evidence.
16. Avoid Performance Fixes That Create New Problems
Some optimisation techniques improve one measurement while making another part of the website less reliable.
Aggressive JavaScript delay can prevent important menus or interactive features from working.
Combining scripts can introduce execution order problems.
CSS removal can break page layouts.
Incorrect cache rules can expose personalised information.
Lazy loading the main featured image can delay LCP.
These are not theoretical concerns.
Performance tools evaluate loading behaviour, but they do not always understand the business purpose of every website feature.
Test changes carefully.
For WordPress websites, create a staging environment before modifying production settings.
Keep a backup and change one major configuration at a time.
After enabling a caching or optimisation feature, inspect:
Desktop and mobile navigation.
Search functionality.
Contact forms.
Login and account pages.
Advertising placements.
Embedded media.
Article layouts.
Images and thumbnails.
Consent and privacy controls.
Any payment or subscription functionality.
Also examine whether the optimisation introduces console errors or failed network requests.
A website can achieve a better laboratory score while losing important functionality.
That is not a successful optimisation.
Avoid installing several performance plugins that perform the same operations.
Two caching systems or multiple JavaScript optimisation tools can conflict and make troubleshooting considerably harder.
Keep the configuration understandable.
A smaller set of properly maintained tools is usually easier to manage than a collection of overlapping extensions.
Finally, do not chase a perfect PageSpeed score at the expense of actual visitor experience.
Prioritise improvements that reduce meaningful delays, make interactions responsive, and keep the layout stable.
A Faster Website Starts With Accurate Diagnosis
A slow website running on good hosting is usually a sign that performance needs to be examined beyond the server specification.
The application may generate pages inefficiently, the database may perform unnecessary queries, images may be oversized, or the browser may be processing too much JavaScript before visitors can interact with the content.
Start with PageSpeed Insights, Chrome DevTools, and Search Console.
Identify whether the delay occurs before the first response, during resource loading, or while the browser renders and processes the page.
Then address the specific bottleneck, measure the result, and verify that the website remains fully functional.
A well configured hosting environment is valuable, but the best results come when infrastructure, application code, caching, content delivery, and frontend design work together.
Before paying for more server capacity, make sure the resources you already have are being used efficiently.