

How to Fix High RAM Usage on Windows 10 and 11 With Safe Steps
By Evander Thorne · November 14, 2026
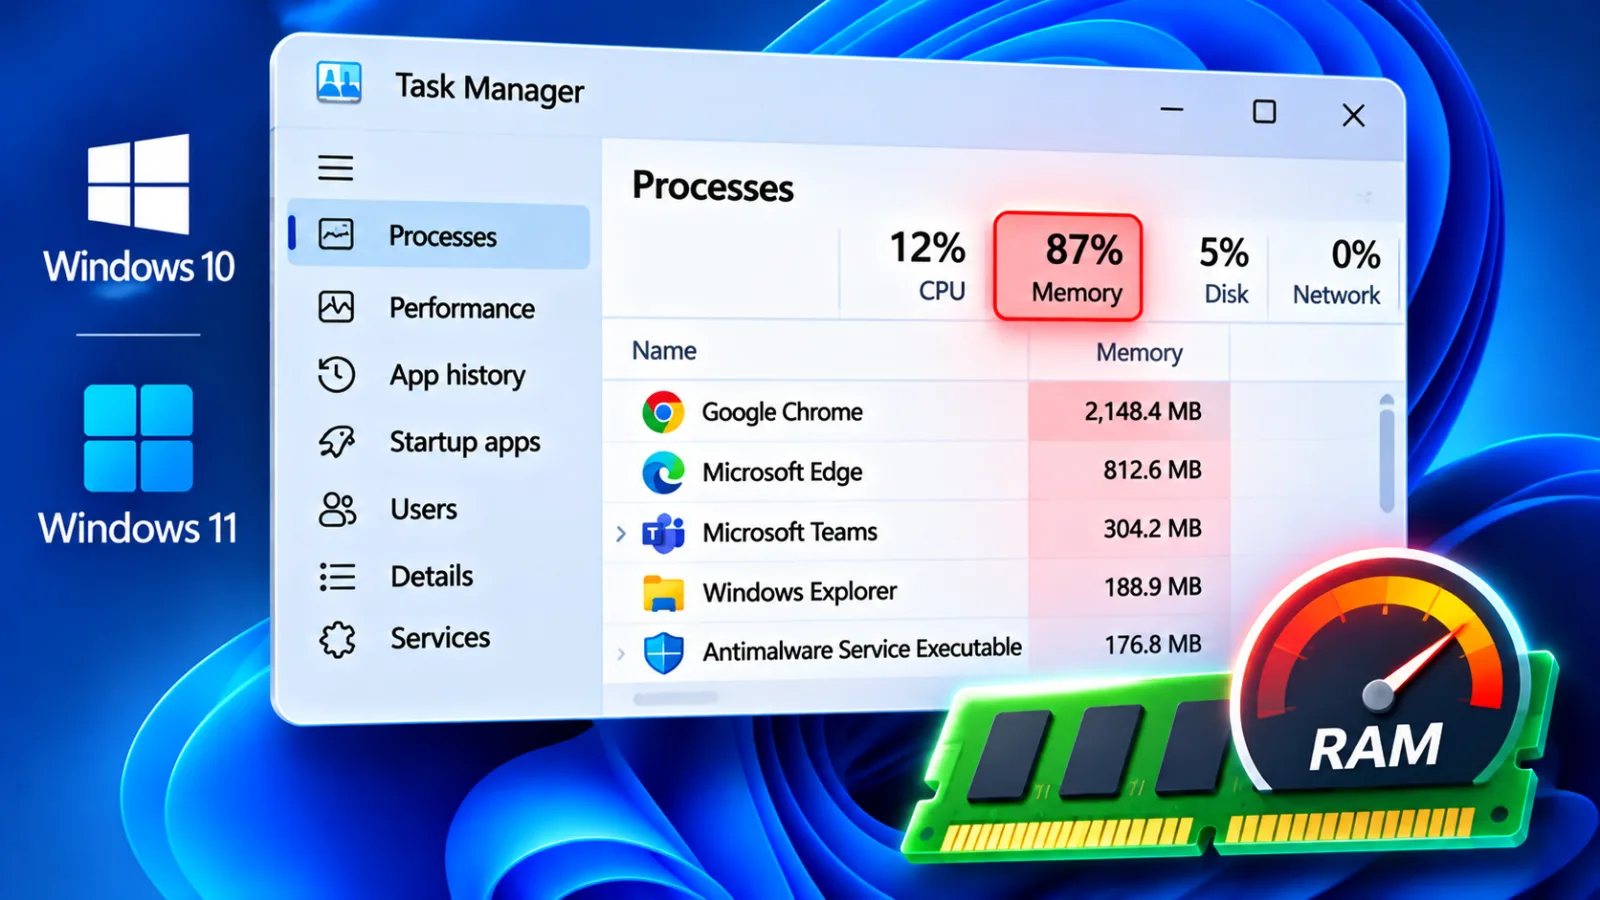
Table of contents
When Windows runs short of available memory, applications become sluggish, browser tabs reload, games stutter and the computer may freeze or display out of memory errors.
The first step is to identify where RAM is going.
Task Manager shows application memory use, while Resource Monitor and Microsoft Sysinternals RAMMap can reveal allocations that ordinary process lists do not explain.
The right fix depends on whether the computer is using memory normally, running too many applications, suffering from a software leak or reaching the physical limits of its installed RAM.
High memory use does not automatically indicate a fault.
Windows deliberately uses available RAM for application working sets, file caching and memory management, and it can reclaim some cached memory when another application needs it.
A computer showing a high percentage of memory in use may still be operating normally if enough memory remains available and applications respond quickly.
The important signs are persistent memory pressure, increasing committed memory, frequent disk activity and performance problems during ordinary work.
Understand RAM usage
Random access memory, or RAM, is the fast working area used by Windows, applications and services while the computer is running.
Unlike storage on an SSD or hard drive, RAM holds data that the processor needs to access quickly during active work.
When available memory becomes scarce, Windows can compress some memory pages and move less frequently used data to the page file on storage.
This helps the system continue operating, although heavy paging can make applications respond more slowly.
Normal memory use
Windows does not have one universal idle memory percentage that applies to every computer.
A system with several browser tabs, Microsoft 365 applications, antivirus protection and synchronization services will naturally use more RAM than a computer running only the desktop.
Cached memory is often reclaimable, so a high memory figure by itself does not prove that an application is consuming resources unnecessarily.
Check available memory and overall responsiveness before deciding that the system needs optimization.
These Task Manager figures help explain what Windows is doing:
In use: Physical memory currently used by Windows, applications and drivers.
Available: Memory that can be allocated to applications immediately, including reclaimable standby memory.
Committed: Memory that Windows has promised to processes, backed by physical RAM and the page file.
Cached: Data retained in memory to speed up future access, much of which can be reused when needed.
Paged pool: Kernel memory that can be written to the page file.
Non paged pool: Kernel memory that must remain in physical memory.
The distinction between physical memory and committed memory matters.
A computer can have available RAM while committed memory approaches its limit, or show high physical memory use because Windows is retaining useful cached data.
Microsoft explains that the commit limit is based on physical memory and the page files configured on the system.
Recognize memory pressure
Memory pressure occurs when applications and Windows need more physical memory than is readily available.
The system may then compress memory, reclaim cached pages or rely more heavily on paging.
These actions help prevent immediate application failures, but repeated disk access can make a computer with limited RAM feel extremely slow.
The most useful diagnosis combines Task Manager figures with symptoms rather than relying on a single percentage.
Look for these signs:
Available memory remains very low during normal work.
Committed memory approaches the displayed commit limit.
Applications become slow when several programs are open.
Browser tabs reload after switching between them.
Disk activity increases while applications are unresponsive.
Memory consumption continues to rise even after the workload stops.
Windows displays low memory notifications or applications report allocation errors.
A high cached figure is not necessarily a problem, and a full page file does not automatically prove that the system is failing.
Microsoft recommends interpreting memory counters together, including available memory, committed bytes, working sets and paging activity.
Find the memory consumer
Task Manager is the quickest way to identify applications using large amounts of RAM.
It provides a live view of process memory, allowing you to sort applications by their current consumption and identify the largest users.
Start with the Processes tab, then inspect the Performance tab to understand the condition of the entire system.
This first check often identifies browsers, virtual machines, editing software or other applications that account for most of the memory in use.

Norton 360 Deluxe
Norton 360 Deluxe delivers strong antivirus protection across five devices along with unlimited VPN parental controls and 50GB cloud backup. This review examin…
- Excellent malware detection rates
- Unlimited VPN no limits
- Higher renewal pricing
- Parental controls miss macOS
Use Task Manager
Follow these steps on Windows 10 or Windows 11:
Press Ctrl + Shift + Esc to open Task Manager.
Select More details if the compact view appears.
Open the Processes tab.
Select the Memory column heading to sort processes by memory use.
Identify applications you recognize that consume substantial RAM.
Expand grouped applications to inspect individual processes or browser tabs.
Open Performance and select Memory to review installed, available, cached and committed memory.
Do not terminate unfamiliar Windows processes simply because they appear near the top of the list.
Save work and close applications normally before using End task on a program that has stopped responding.
If the memory figure remains high after closing the largest applications, inspect the Performance tab and look for memory allocated outside ordinary application working sets.
Inspect Resource Monitor
Resource Monitor provides a more detailed view of physical memory allocation.
It is useful when Task Manager does not clearly account for the memory in use or when you need to distinguish working sets, standby memory and modified pages.
Press Windows + R, enter resmon and press Enter.
Open the Memory tab and review the memory breakdown and the processes listed below it.
Pay attention to the Hard Faults/sec column when the computer is slow.
A hard fault means Windows must retrieve a memory page from storage rather than finding it in physical RAM; it does not necessarily mean that the RAM hardware is defective.
A sustained pattern of hard faults alongside low available memory and heavy disk activity can indicate paging pressure.
Interpret the figure alongside application responsiveness and disk performance rather than treating every hard fault as an error.
Microsoft Learn+1
Identify hidden allocations
Task Manager does not provide a complete breakdown of every physical memory allocation.
Kernel components, drivers, file cache and other system structures can account for RAM that is not easily attributed to a visible application.
Microsoft Sysinternals RAMMap is designed to show how Windows assigns physical memory across processes, file data, drivers and other categories.
It is particularly useful when the total memory in use is much higher than the process list appears to explain.
To inspect memory with RAMMap:
Download RAMMap from the official Microsoft Sysinternals website.
Extract the downloaded archive.
Run RAMMap as an administrator.
Open the Use Counts tab to review memory by allocation type.
Select the Processes tab to compare process working sets.
Review File Summary and File Details when cached file data appears unusually large.
Refresh the display and compare the figures after closing unnecessary applications.
RAMMap is an analysis tool, not a memory cleaner.
Its purpose is to explain how physical RAM is being used, including allocations that Task Manager may not show clearly.
Avoid emptying standby lists as a routine fix because Windows may need to cache the same data again, and clearing reclaimable memory does not repair the process or driver responsible for persistent growth.
Fix common causes
Once you have identified the largest memory consumers, reduce unnecessary activity before changing advanced Windows settings.
Closing unused applications, reducing browser tabs and limiting unnecessary startup programs can recover memory immediately.
These measures are especially useful on computers with 4 GB or 8 GB of RAM, where several ordinary applications can consume most available capacity.
If the same application repeatedly fills memory after a restart, investigate its configuration or update history.
Close unused applications
Applications retain memory while they are open, including processes that remain active in the background.
Browsers, video editors, image editing software, development environments and virtual machines can use substantial amounts of RAM.
Close applications that are no longer required, then check Task Manager to confirm whether available memory increases.
If memory consumption returns to the same level during normal work, identify which application grows rather than repeatedly closing everything.
Reduce browser memory
Modern browsers use separate processes for tabs, extensions, rendering and background services.
A browser with many active tabs can consume several gigabytes of memory, particularly when pages contain video, large web applications or complex scripts.
Close tabs that are no longer needed and remove extensions that you do not recognize or use.
Chrome and Edge also provide built in task management tools that can help identify individual tabs or extensions using excessive resources.
For a practical browser cleanup:
Close tabs that are no longer relevant to your work.
Open the browser's built in task manager.
Sort the entries by memory use.
Identify tabs or extensions consuming unusually large amounts.
Close the affected tab or disable the extension.
Restart the browser and compare memory use during the same workload.
Do not disable every extension without checking its purpose.
Password managers, accessibility tools and business applications may depend on browser extensions.
If one extension repeatedly consumes memory, update it or remove it and test whether the problem returns.
Disable startup applications
Startup applications can consume RAM before you open any programs yourself.
Cloud synchronization clients, messaging applications, game launchers and device utilities may load automatically after sign in.
Disabling unnecessary startup entries reduces the initial memory demand and can make older computers more responsive.
Keep applications that provide security, backup or essential device functions enabled.
Open Task Manager.
Select Startup apps on Windows 11, or the Startup tab on Windows 10.
Review the applications listed.
Check their startup impact.
Select an application you do not need at sign in.
Choose Disable.
4.7AntivirusNorton 360 Deluxe
4.7Norton 360 Deluxe delivers strong antivirus protection across five devices along with unlimited VPN parental controls and 50GB cloud backup. This review examin…
- Excellent malware detection rates
- Unlimited VPN no limits
- Higher renewal pricing
- Parental controls miss macOS
Restart Windows and compare memory use after login.
Disabling a startup entry does not uninstall the program.
It prevents automatic launch, and you can still open the application manually when required.
Avoid disabling unknown services or security tools simply to lower the memory percentage.
Limit background activity
Some applications continue to run tasks after their windows are closed.
Windows 11 provides background permission controls for supported applications, although traditional desktop software may manage its own background behavior.
Open Settings, select Apps, then Installed apps.
Choose the application, open its advanced options when available and review Background app permissions.
Set an application to Never only if it does not need to synchronize files, receive notifications or perform another background function.
OneDrive, backup clients, endpoint security and collaboration tools may need to remain active.
On Windows 10, background app controls are available under Settings, Privacy and Background apps for supported applications.
The available controls vary by application type and Windows version.
Restart the computer
A restart closes processes and services, clears temporary session state and allows Windows to initialize memory management again.
It can recover memory consumed by an application that has not released its allocations correctly.
If the memory level returns to normal after restarting but gradually increases during the same workload, the pattern may indicate a leak or a recurring application task.
Record the process responsible before relying on frequent restarts as a permanent solution.
Diagnose memory leaks
A memory leak occurs when an application, service or driver continues to allocate memory without releasing allocations that are no longer needed.
The process can start with modest consumption and gradually use more RAM over several hours or days.
Closing and reopening the application may temporarily restore performance, but the problem returns if the faulty component remains installed.
Microsoft documents memory leak investigations for applications and services, including cases where Event ID 2004 records a system resource exhaustion warning.
Recognize a leak
A high memory figure at one moment does not establish that a leak exists.
Look for a process whose memory use continues to increase while the workload remains similar, especially when closing unrelated applications does not reduce the total.
A driver related leak may affect kernel memory pools rather than appearing as one large application in Task Manager.
Compare memory use over time and after restarting the suspect application to establish whether the pattern is repeatable.
Common warning signs include:
One application gradually consumes more memory during a stable workload.
Memory use continues to rise after the application has finished its main task.
The computer becomes slower the longer it remains switched on.
Available memory falls while no new applications are opened.
Non paged pool memory grows continuously.
Windows records repeated resource exhaustion warnings.
A leak can occur in user mode, inside an application or service, or in kernel mode, often through a driver or Windows component.
The distinction matters because reinstalling a browser will not repair a faulty network driver, and replacing RAM will not correct an application that keeps allocating memory.
Monitor memory growth
Performance Monitor can record memory counters over time and help determine whether an application or system component is responsible.
Press Windows + R, enter perfmon and press Enter.
Expand Data Collector Sets, select User Defined and create a data collector set that records relevant memory and process counters.
Useful counters include Available MBytes, Committed Bytes, Pool Nonpaged Bytes, Pool Paged Bytes and Process Private Bytes for the suspected application.
Collect data while the computer performs the workload that normally causes the problem.
A single snapshot may miss a gradual increase, so allow the recording to run long enough to capture the pattern.
If one process's Private Bytes continues rising, investigate that application or service.
If Nonpaged Pool grows while no application explains the change, investigate drivers and kernel allocations.
Check Event Viewer
Windows can record resource exhaustion events when the system runs short of committed virtual memory.
Event ID 2004 from Resource Exhaustion Detector is particularly useful because its description can list processes consuming the most virtual memory at the time of the incident.
Open Event Viewer, expand Windows Logs, select System and inspect events recorded when the slowdown occurred.
Use the event details to identify the largest consumers and compare them with Task Manager.
An Event ID 2004 entry is evidence of memory pressure, not automatic proof of a memory leak.
Check whether the same process appears in repeated events and whether its memory consumption rises over time.
Microsoft recommends examining commit size and using tools such as VMMap and Windows Performance Toolkit for deeper application memory investigations.
Manage virtual memory
The Windows page file is a hidden system file on a storage drive that supports committed memory and allows less frequently accessed modified pages to be moved out of physical RAM.
It helps Windows handle workloads that exceed available physical memory and can also support crash dump creation.
Disabling the page file can reduce the system commit limit and cause applications to fail when memory demand increases.
For most users, leaving the page file system managed is the safest configuration.
Keep the page file automatic
Windows adjusts a system managed page file according to memory demand, available storage and crash dump requirements.
Microsoft explains that the commit limit combines physical memory and page files, and that reaching this limit can cause freezes, crashes and allocation failures.
A large page file does not make an SSD or hard drive as fast as RAM, but it provides additional backing for committed memory.
Keep sufficient free space on the drive that hosts the page file.
To check the current setting:
Press Windows + R.
Enter sysdm.cpl and press Enter.
Open the Advanced tab.
Under Performance, select Settings.
Open the Advanced tab in Performance Options.
Under Virtual memory, select Change.
Check whether Automatically manage paging file size for all drives is selected.
If you changed the setting, restore automatic management and restart Windows.
Manual page file sizing is a specialist workaround for particular allocation problems, not a general way to reduce RAM usage.
Microsoft documents a Windows client issue in which frequent memory allocations can fail while an automatically managed page file grows, but the workaround is specific to that condition.
Do not apply fixed sizes copied from generic optimization guides without measuring actual commit demand and considering crash dump requirements.
Understand memory compression
Windows can compress less frequently used memory pages so that more data remains in physical RAM without immediately moving it to the page file.
Task Manager may show memory compression as part of the system's memory use.
Compression is a normal memory management feature, and disabling it may increase paging or reduce performance when physical RAM is limited.
Investigate the application or workload creating pressure before changing this setting.
Check Windows and hardware
Persistent memory pressure can result from outdated software, incompatible drivers, faulty RAM or a computer that does not have enough physical memory for its normal workload.
Update applications that show repeated growth and check drivers from the computer manufacturer's support page.
A clean boot can help determine whether a third party service or startup application contributes to the problem.
If memory remains high with minimal applications running, investigate system allocations and hardware before reinstalling Windows.
Update applications and drivers
An application update may correct memory management problems, while a driver update may address excessive kernel memory allocation.
Start with the software that Task Manager or Performance Monitor identified.
Check the application's own update mechanism and the hardware manufacturer's support page for drivers designed for the exact computer model.
Avoid third party driver download utilities that may install incompatible packages or additional software.
Prioritize software that remains active throughout the session, such as browsers, endpoint security, synchronization clients, virtualization tools and hardware monitoring utilities.
If the issue began immediately after a driver update, check Device Manager to see whether Roll Back Driver is available.
Change one component at a time and compare memory use after restarting, so you can identify which change affects the result.
Run a clean boot
A clean boot can isolate third party services and startup programs that consume memory.
Press Windows + R, enter msconfig and open the Services tab.
Select Hide all Microsoft services before choosing Disable all, then use the Startup tab to open Task Manager and disable third party startup entries.
Restart Windows and observe memory use before opening your usual applications.
If memory use returns to normal, re-enable services and startup entries in small groups until the problem reappears.
This identifies the conflicting component more reliably than disabling multiple services permanently.
Restore normal startup settings after testing, and do not disable Microsoft services or essential security tools as a routine memory reduction technique.
Test physical memory
Faulty RAM can cause application crashes, corrupted data and system instability.
Windows Memory Diagnostic can check memory hardware for errors, although it does not identify software leaks or explain every cause of high memory use.
Save open work, press Windows + R, enter mdsched.exe and choose Restart now and check for problems.
The computer will restart and run the memory test before returning to Windows.
If the test reports errors, repeat the test if necessary and consider a hardware diagnostic from the computer manufacturer.
On a desktop with removable memory modules, a qualified technician can test modules individually and inspect their seating.
Do not assume that a high memory percentage means the RAM itself is defective; hardware testing is appropriate when there are errors, crashes or other evidence of instability.
Norton 360 Deluxe
Norton 360 Deluxe delivers strong antivirus protection across five devices along with unlimited VPN parental controls and 50GB cloud backup. This review examin…
- Excellent malware detection rates
- Unlimited VPN no limits
- Higher renewal pricing
- Parental controls miss macOS
Decide on a RAM upgrade
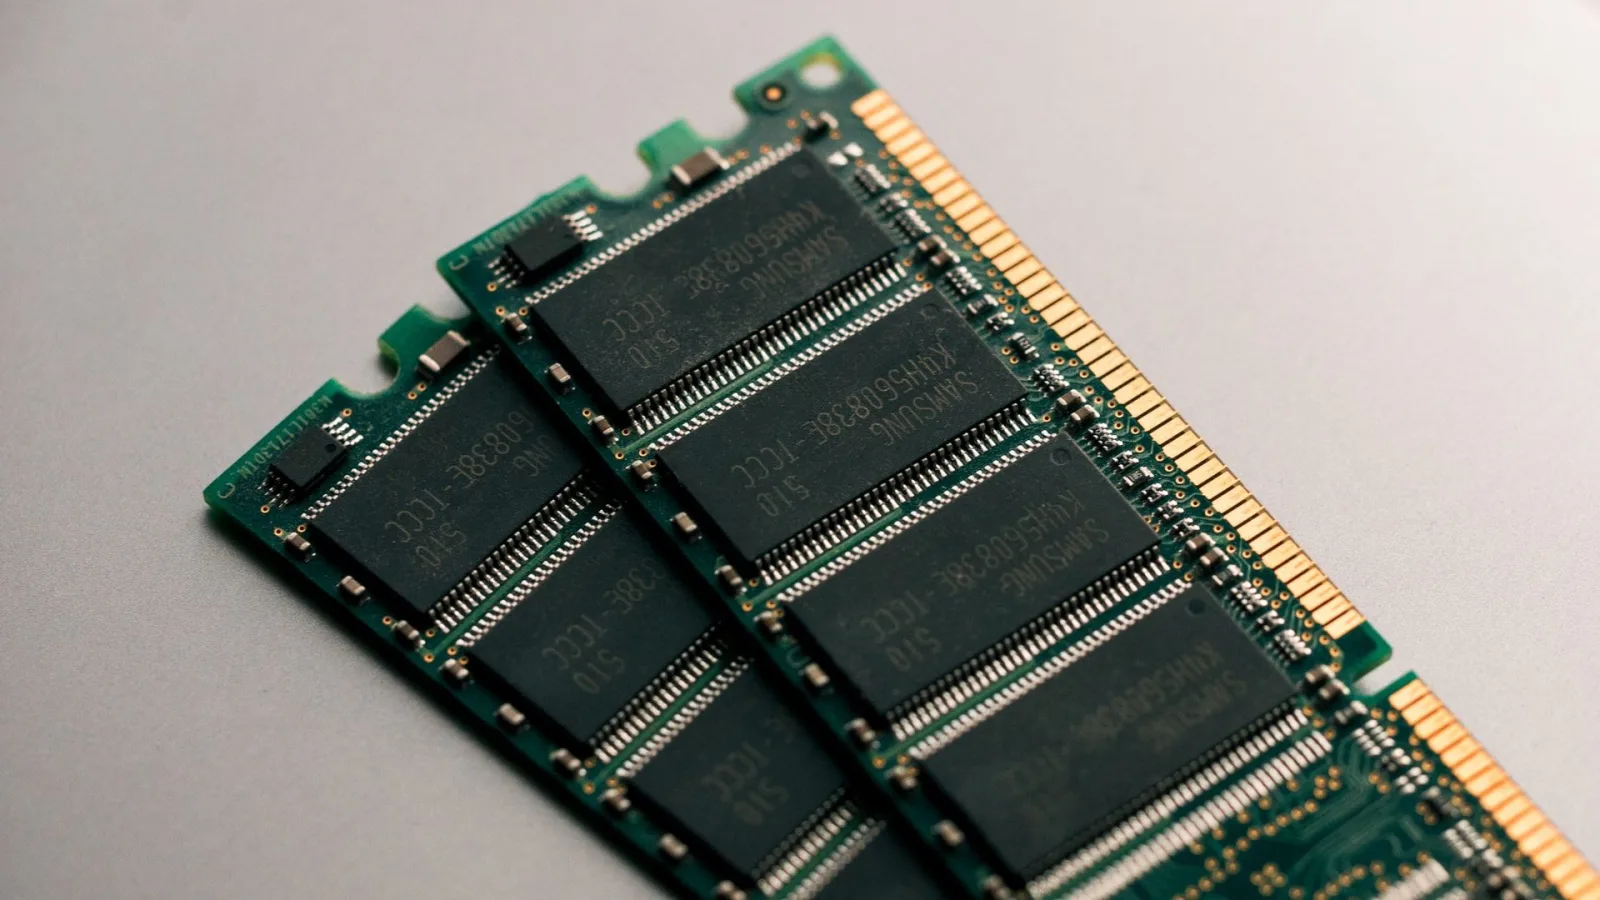
Software adjustments can reduce unnecessary memory demand, but they cannot increase the physical RAM installed in the computer.
If your normal workload repeatedly exhausts available memory, adding RAM may provide a more effective improvement than constantly closing applications.
Before buying memory, check the motherboard or laptop specifications for supported capacity, memory type, speed and available slots.
Some laptops have soldered memory that cannot be upgraded.
Check installed capacity
Open Task Manager, select Performance and choose Memory.
Review the installed capacity, memory speed, form factor and Slots used information where available.
You can also check the computer manufacturer's technical specifications for the maximum supported memory and compatible modules.
Do not purchase RAM based only on the physical appearance of the existing module because DDR generations and supported speeds differ.
The right capacity depends on the workload.
A computer used for basic browsing and document editing has different requirements from a workstation running virtual machines, large spreadsheets, development environments or video editing software.
Measure memory use during your actual working day, including the applications you need simultaneously.
If the same workload repeatedly leaves very little available memory and causes paging, a hardware upgrade may be justified.
Choose the right capacity
Use the following as practical workload categories, not fixed Windows requirements:
4 GB: Very limited for current multitasking and modern desktop applications.
8 GB: Suitable for basic work with a modest number of applications and browser tabs.
16 GB: A practical capacity for many office, browsing and general productivity workloads.
32 GB: Useful for heavier multitasking, development tools, creative applications and larger projects.
64 GB or more: Relevant to demanding professional workloads, virtual machines and specialized software.
The amount required depends on the applications, files and services in use.
A workstation running multiple virtual machines may need substantially more memory than a computer used for email and documents.
Check application requirements and the system's supported maximum before purchasing modules.
Consider Windows 10 support
Windows 10 reached the end of standard support on October 14, 2025.
Computers can continue to run the operating system, but eligible editions no longer receive regular security and feature updates unless covered by an applicable Extended Security Updates arrangement or a different lifecycle policy.
If an older computer has limited RAM and cannot meet Windows 11 hardware requirements, consider its longer term support position before investing in a major memory upgrade.
Frequently Asked Questions
Why is Windows using 80 percent of my RAM?
Does clearing RAM improve computer performance?
Can a virus cause high RAM usage?
Should I disable SysMain to save RAM?
How much RAM does Windows 11 need?
Will increasing virtual memory solve high RAM usage?
Sources6
- All Things How on Windows RAM analysis
- Microsoft Support on Windows 10 support
- Windows Central on reducing Windows RAM use
- Fix High RAM Usage in Windows 10 & 11
- What is eating up your RAM and how to fix it
- Cutting Down RAM Consumption
External pages are independent third-party sources. Desking App does not control or endorse their content and accepts no responsibility for it. Visiting them is at your own responsibility and risk.